
Unpacking M+R’s 2023 Nonprofit Benchmarks Study
By Sarah Wallin, Senior Creative Director and Katrina Williams, Senior Marketing Manager
It’s the *second* most wonderful time of the year – for nonprofit fundraisers, that is. Because this is the time of year when we start seeing the finalized benchmark reports and top takeaways from the previous year: in this case, the full 2023 M+R Benchmarks Study on digital giving.
It can be comforting… or terrifying! It’s when we see if the results our BDI client partners experienced are taking place across a whole bunch of sectors across the industry. Or we see trends that maybe didn’t impact our clients… yet. But certainly will at some point!
We’ve been digging into this study – set up as a quirky tasting menu of reporting – and talking about it a lot in the hallways at BDI. And we have thoughts! There are a lot of great learnings about online giving from the M+R Benchmarks that are worth checking out.
Here’s an executive summary of the ones we found most important and relevant!
*Opinions may vary 😀
1. About That Hunger/Poverty Sector Stat…
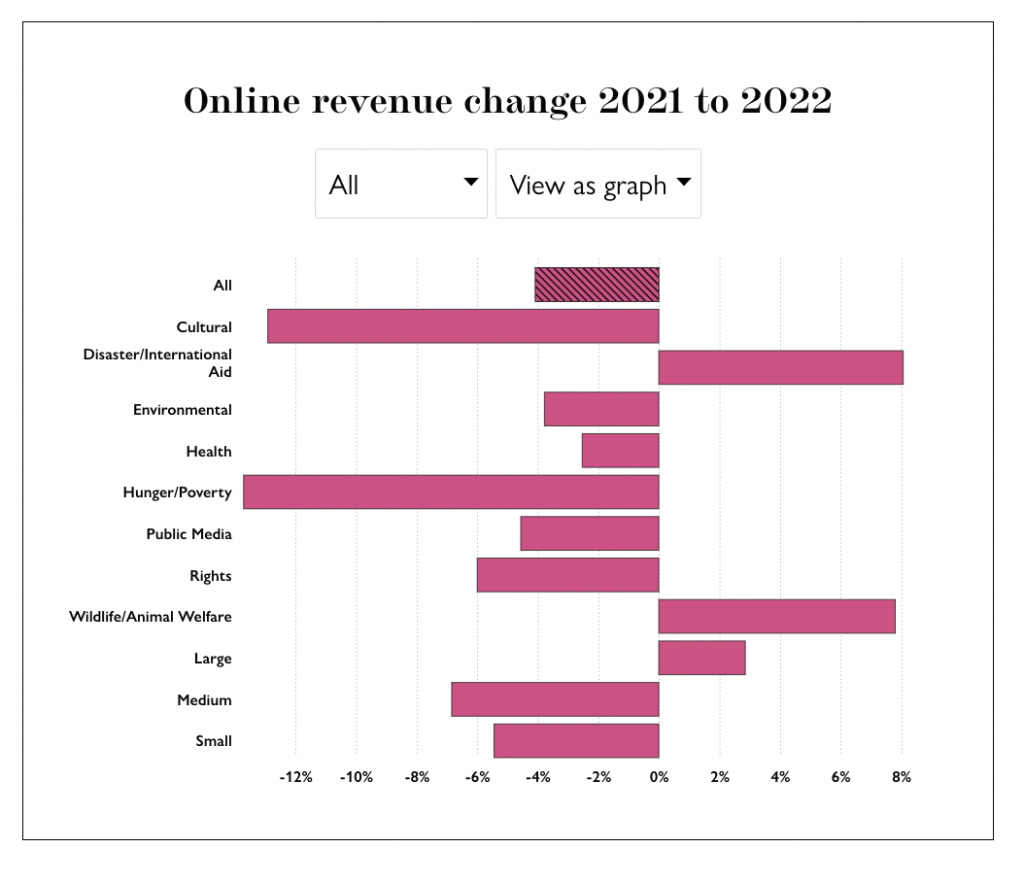
So the M+R Benchmarks Report shows that in 2021-2022, overall online giving experienced a decline of 4%… but in the hunger/poverty sector, it was 14%. OOF. Many of BDI’s client partners, who are part of this sector, saw a significantly less overall decline, but even so – any declining response still hurts!
Things to keep in mind:
- These overall numbers are based on 215 organizations; that’s smaller than the Blackbaud Charitable Giving report or Giving USA reports. It doesn’t make these results less valid, but note that it is a smaller sample size.
- Hunger/poverty sector had an even larger decline in 2020-2021 – a 35% drop! Why? Read on…
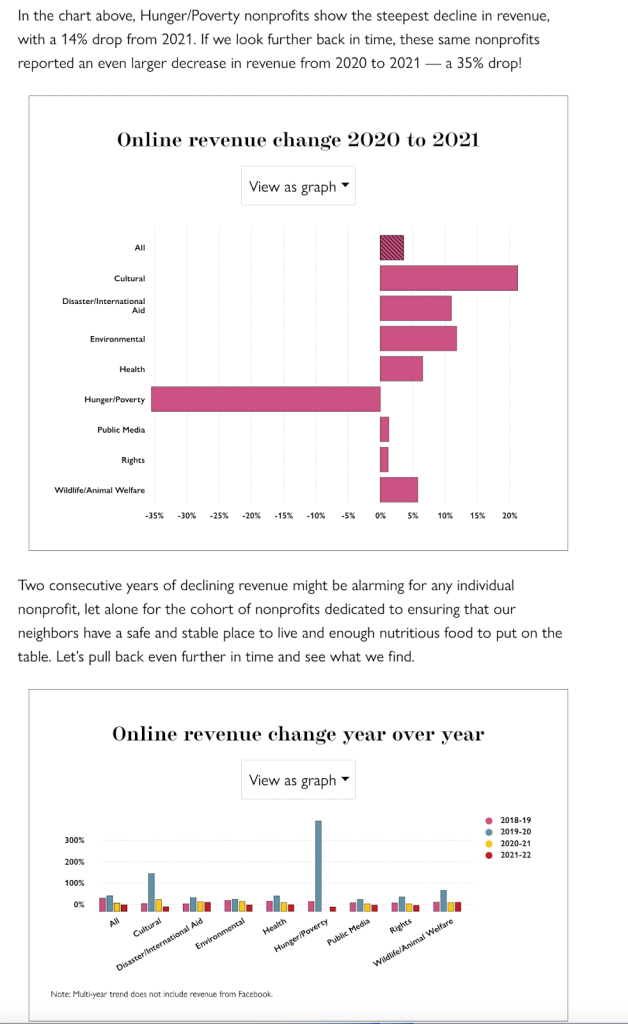
- That “unprecedented” COVID year! Between 2019-2020, the M+R Benchmarks report notes this sector experienced a 390% YOY increase in online revenue. So a 35% and 14% decline over the last two years – given that initial increase and the challenges of retention – is a lot less surprising, shocking or anxiety-producing.
Takeaways: For nonprofits experiencing declines in giving this past year, take heart! You’re not alone – charitable giving saw an overall decline across sectors – and many organizations are coming down from incredible heights of online giving and revenue.
2. Coming Up: Monthly Giving
Let’s be real – for years, monthly givers have been an afterthought for many nonprofit development programs. Not for all! Some nonprofits have supercharged monthly giving programs that get plenty of their attention. But for others, it’s more of a “nice to have, not a need to have.”
Well, friends… that’s changing. Just look at the M+R study’s results on monthly giving vs. one-time revenue online:
- Monthly giving revenue: +11%
- One-time revenue: -12%
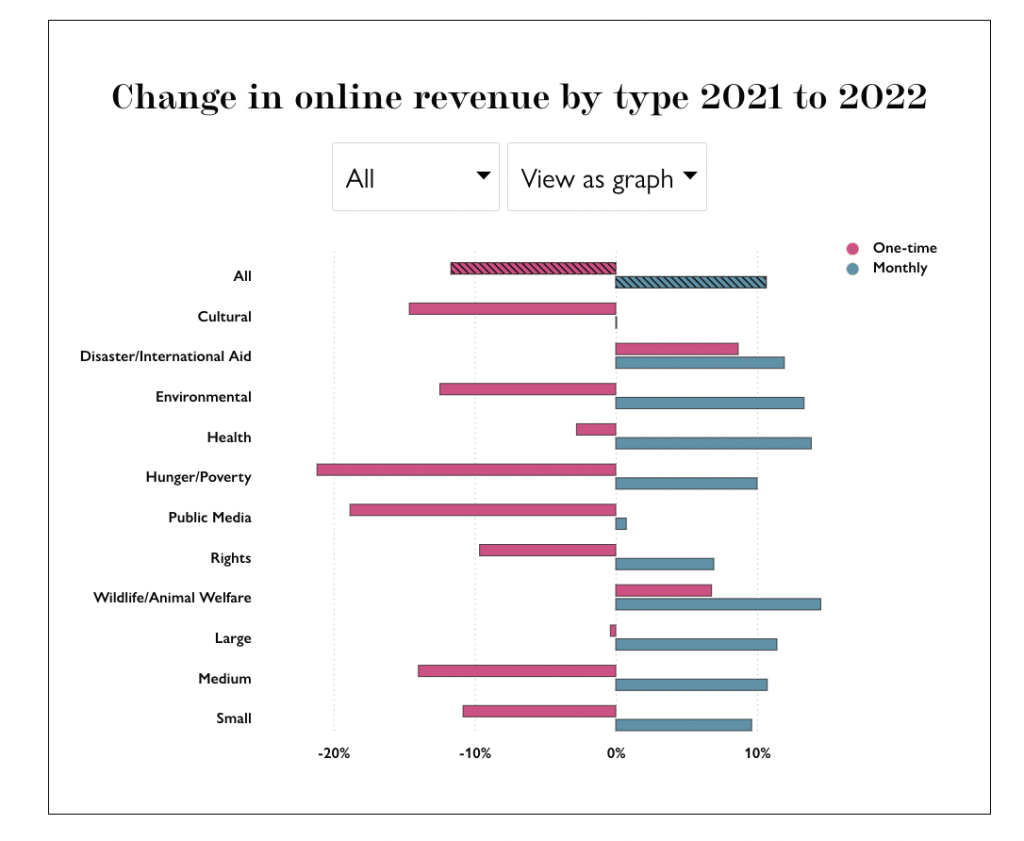
More good news! Monthly giving added up to 28% of ALL online revenue in 2022. This is in line with what BDI saw in the overall monthly giving revenue for clients as well – and encouraging for all those with a dream (or even an inkling) to grow their monthly giving programs. Now is definitely the time!
As our Vice President of Digital Strategy Stephanie Tippitt puts it: “We’ve been helping our clients grow their monthly giving revenue year over year. It’s been exciting to see the numbers increasing – and we believe this is just the start!”
Check out the overall average gift stats for monthly giving vs. one-time revenue. This is just one more reminder of how powerful these monthly gifts can be over the course of a year!
- Monthly givers: 9.8 gifts over 1 year, on average
- One-time givers: 1.2 gifts over 1 year, on average
- Monthly givers: $25 average gift (25 x 9.8 gifts over 1 year = $245)
- One-time givers: $121 average gift
- Monthly givers: $287 contributed over 2022
- One-time givers: $192 contributed over 2022
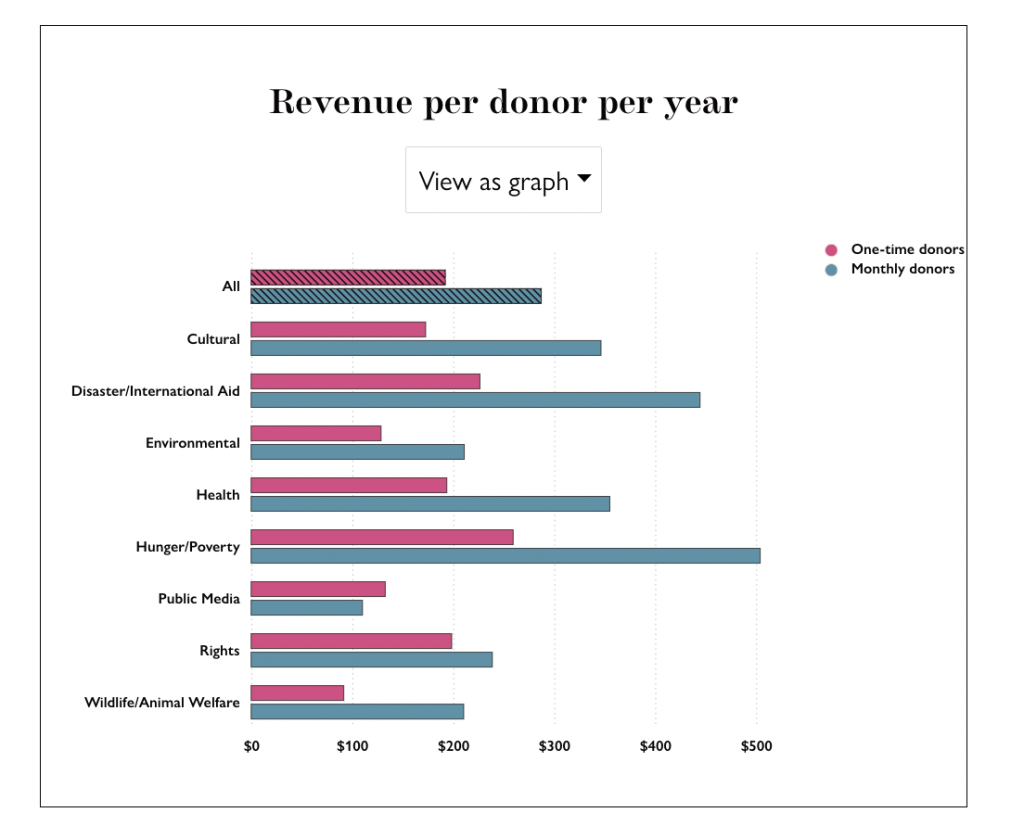
Some sectors show what a dramatic difference monthly giving makes. For Hunger/Poverty nonprofits, one-time donors contributed an average of $259, while monthly donors gave $504 in 2022.
Takeaways: If you’re not investing in an online monthly giving program, get going! If you’re already engaging new monthly givers, take it up a notch. Not only do these donors give more often, but their annual contributions also add up to more revenue for your cause. Plus, their long-term value as donors is off the charts.
3. Facebook is not dead… yet
Over the last year, Facebook has made some major algorithm updates that changed the types of most-shared content on the feed. With these changes, nonprofits have spread their wings outside of the Facebook platform to connect with supporters on other social channels.
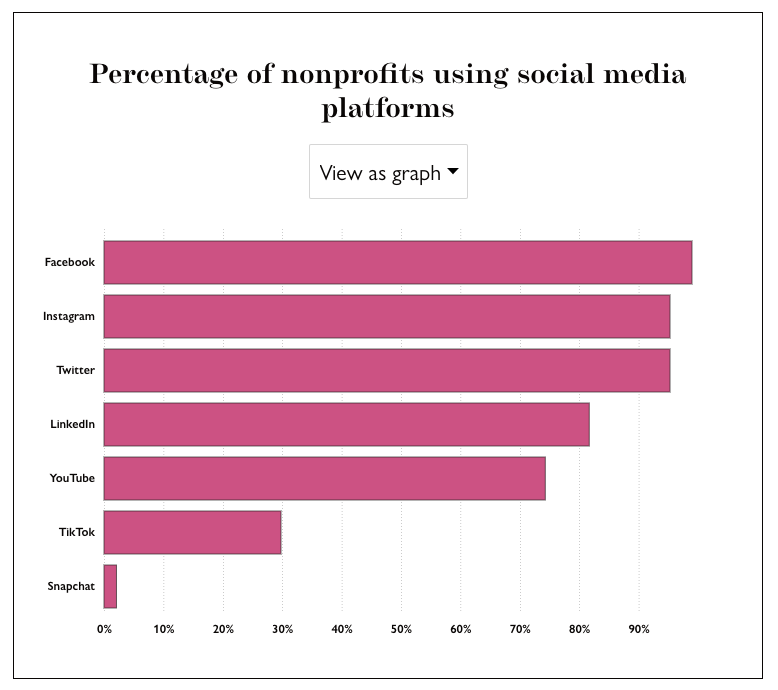
As shown in the image above, Facebook, Instagram and Twitter have near-universal adoption from nonprofits, as well as a major presence on LinkedIn (82%) and YouTube (74%). It’s clear that social media is a big part of nonprofit fundraising today… but these numbers show just how true that is:
- Among the three most-used platforms, nonprofits had 10% more Instagram followers in 2022 than in 2021, while Facebook followers increased by 4% and Twitter’s audience remained the same year-over-year.
- Nonprofits tended to have more fans on Facebook than other platforms. For every 1,000 email addresses, nonprofits had an average of 685 Facebook fans, 160 Instagram followers and 208 Twitter followers.
Of course, reaching an audience is just the beginning. The next step is actually getting them to engage with your content and taking the extra step to support your nonprofit. On Facebook, not only did the share of online revenue decline from 2021 (34% overall), but the amount raised was lower for most general nonprofit types.
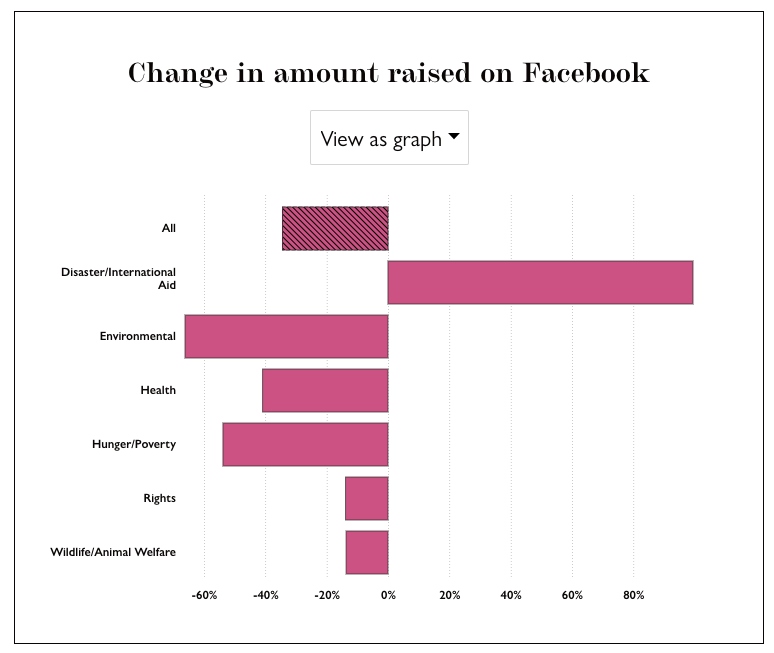
According to this report, the most likely driver to the Disaster/International Aid sector was the conflict in Ukraine. People donated to the seemingly most urgent need at hand – which could have had a negative effect on the other sectors.
According to the report, the average Facebook Fundraiser generated 4 gifts, with an average of $34. Overall, Facebook Fundraisers accounted for 1.1% of total online revenue.
Even though giving through Facebook Fundraisers was down in almost every sector, it’s important to note that people are still giving through Facebook, and though they are modest numbers… there are still inspired people on the platform, willing to take the time to give.
Takeaways: Don’t give up on social media fundraisers! Audiences on almost every platform have seen growth (especially Instagram) – which means more people connecting with your content online. Even though Facebook is still relevant, don’t put all your eggs in one Zuckerberg basket. Diversify by reaching different audience types on other social platforms.
4. Where are your website visitors coming from?
There’s nothing worse than clicking over to a website that hasn’t been optimized for mobile. It takes too long to load, the text is too small, the images are cut off… it’s a mess. Don’t be that website.
Optimizing your donation page for mobile is more important than ever. In 2022, the majority of nonprofit website traffic came from users on mobile devices, representing 57% of all visits.
If you need some tips on how to best optimize your website, check out this great article from BDI VP Digital Strategy, Stephanie Tippitt.
So here’s where it gets interesting: Even though 57% of nonprofit website traffic came from mobile devices, these visits generated just 36% of donations transactions and 25% of revenue.
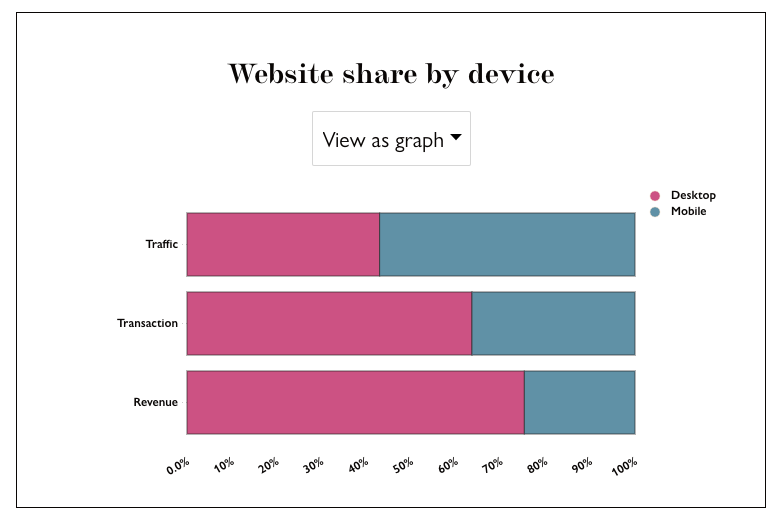
Meaning, users on desktop devices made up the majority of donations transactions (63%) and revenue (75%). And the donors who did donate through desktop gave more overall. The average nonprofit gift made on desktop was $194, and the average gift for mobile users was $94.
Overall, mobile users are still less likely to give than desktop users, and when they do give, the average gift size is lower.
A few interesting organic website benchmarks to consider:
- Organic traffic was 38% of all nonprofit website visits in 2022.
- Overall, 0.23% of organic website visitors made a donation.
- Organic website visitors who donated generated an average of $0.77 per visitor.
Takeaways: Even though more overall revenue is coming from desktop users, the majority of nonprofit website traffic is still coming from mobile! Herein lies a great opportunity to increase revenue by improving the conversion rate of website visitors. The first step is to optimize your website as a whole – especially your donation page.
This article from BDI VP Digital Strategy, Stephanie Tippitt walks you through 4 of the most important questions to consider when optimizing your donation page. Check it out!
Conclusion:
So, in short – the M+R Benchmark study shows that 2022 has been a transitional and stabilizing year for many nonprofits after the highs of pandemic fundraising and marketing. Of course, that includes some declines in overall giving – but not such significant declines that should give cause for worry. And because those years jumpstarted more digital fundraising and marketing, we’re now seeing the benefits in new, exciting forms of outreach and communication online.
If you want to talk more about this, the BDI team – especially our awesome Digital Team – is here to talk benchmarks, anytime! In fact, they just released an article on the digital findings from BDI’s 2022 client results.
Get in touch with us, and we’ll be glad to answer any questions or dig into the research with you more. That’s what we’re here for!
Check out last week’s Quick Shot – “But That’s Not How I Talk!”