

The key differences between GA4 and UA
By Mindy VanderHoeven, Director of Digital Analytics and Operations
Out with the old, in with the new! If you’re a user of Google Analytics, then you’re likely aware that Google Analytics 4 (GA4) has taken the spotlight as the primary source for website metrics as of July 1. We all knew it was coming, but now the time is finally here to say goodbye to Universal Analytics (UA), a long-standing companion for many marketers, including nonprofit fundraisers. There’s been a lot of talk about the transition to the new GA4 model, and for a good reason – it differs significantly from the familiar model we’ve grown accustomed to over the years.
The first time you log into GA4, it can be confusing. So, let’s dive into the key differences between Google Analytics 4 and Universal Analytics, and discover how to locate crucial website insights in this new world.
Different data models
UA and GA4 use different data models to collect information. UA relied on sessions and pageviews, while GA4 is built upon events and parameters. The event-based model in GA4 treats every user interaction as a standalone event. This new approach offers deeper insights into user behavior across various channels, platforms and devices. Both ways can collect and tally data, but how it looks in the reports will be different.
As a result of these fundamental changes in how data is measured, comparing information between the two won’t be apples-to-apples. This is unfortunate when looking at past website traffic numbers, but hopefully if you set up your GA4 account last year, then you will have at least a year of historical data to compare it to.
In GA4, you’ll notice that a metric may be called the same thing as in UA, so you’ll be tempted to believe the number should completely match up. But here are a few key differences to know about:
Sessions are counted differently
The main difference lies in how UA and GA4 define a session. Let’s look at the difference in how the two are calculated:
- UA used a time-based approach, with sessions ending after 30 minutes of inactivity, a campaign change or at midnight (whichever comes first). A campaign change is if a user arrives via one campaign, leaves and then comes back via a different campaign.
- GA4 adopts an event-based model and only ends after 30 minutes of inactivity. This distinction allows GA4 to offer more detailed insights into user engagement across different digital touchpoints.
Let’s look at an example: A donor sees a Facebook Ad from your organization and clicks on a link and goes to your website. After browsing around on your site for a few minutes, they decide to check their email and see an email from your organization and then click on a link that goes to a donation page on your site. In the previous UA model, this would be considered two separate sessions even though they hadn’t left your site. When they came to your website again through a different source, the donor had essentially entered twice, so the first session stops. In GA4, it would still just be one session and both traffic sources would be part of the same session.
Everything is an event!
In UA, user interactions were tracked via page views, but this left gaps since they didn’t account for other interactions with your website, such as video watches, clicks and form submissions. In GA4, every action, interaction or engagement with your site is considered an event. Whether it’s a pageview, a click, a donation or any other user action, each is categorized as a separate event.
Rethinking how we view website performance
GA4 offers a fresh perspective on defining successful interactions for your website and prioritizing what truly matters. Look out for a few changes to GA4 metrics:
Engaged sessions
Not all sessions are created equal! Some people land on your website and may leave immediately and some may spend more time on your site, reading about your organization, making a gift, etc. To measure these different levels of engagement, GA4 offers a new metric called “Engaged Sessions.” It is a session where users actively interact with the content on your site, spending a significant amount of time engaging with it. An Engaged Session is calculated as any session that lasts longer than 10 seconds or had a conversion event or had two or more pageviews.
The concept of Engaged Sessions aims to go beyond merely counting sessions and pageviews and instead focuses on the quality of the experience during a session.
No more bounce rates
Bounce Rates are no longer a metric in GA4. Google has adopted a more positive reporting approach, shifting the focus to engagement rate figures instead. Instead of relying on the bounce rate to assess website performance, you are encouraged to measure success by prioritizing engaged sessions and which actions lead to higher engagement.
Navigating the new interface
When first navigating to Google Analytics 4, you’ll notice that it looks quite different! The new interface places a strong emphasis on user-centric metrics, making it easier to track user interactions, engagement and conversions. Here are a few essential things to know to help you find your way around:
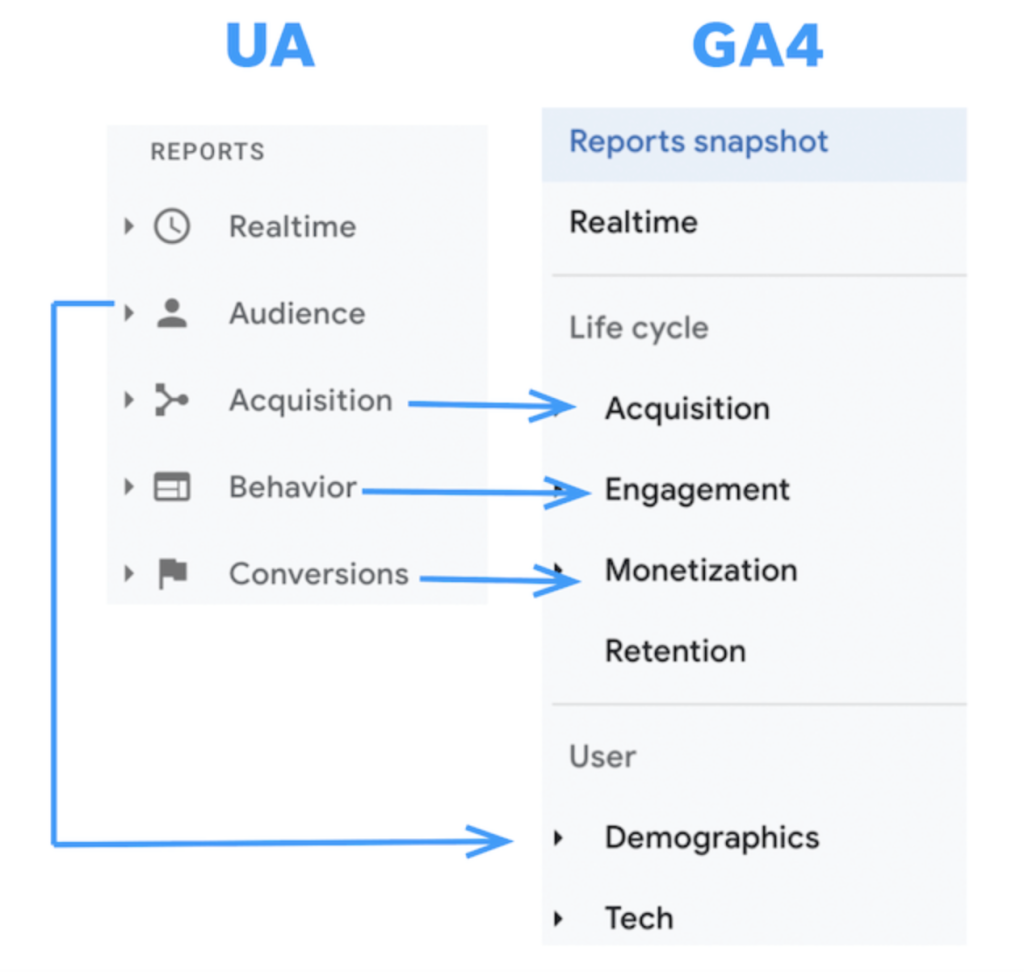
The Default Reports are now divided into sections for Life Cycle and User (see the graphic below to see how these new categories compare to the previous UA sections).
The Life Cycle section is broken up into 4 categories: Acquisition, Engagement, Monetization and Retention.
Acquisition = shows information such as how users are getting to your site and which channels they are using
Engagement = shows what content is the most popular among users and what actions they take
Monetization = shows how your site is creating revenue
Retention = provides an overview of how many users are returning to your site
The User section offers valuable information about the visitors to your site, with a focus on understanding user behavior, demographics and engagement trends.
Quick tip: In GA4, you can easily edit and filter any report to customize the information and gain more specific insights. Take advantage of this in order to drill down to the information you are looking for.
Google Analytics 4 has ushered in a new era in how we measure website performance. Whether you are an experienced user of Google Analytics or new to the platform, navigating GA4 and adjusting to the key differences from UA are going to be quite the learning curve for everyone. But GA4 offers more opportunities to gain valuable insight and understanding for the growth and success of your digital presence.
As always, the BDI Digital Team is here to help guide you through these changes!